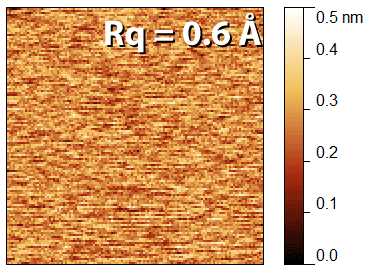
While many other procedures are important for full determination of the performance of an AFM instrument, the Z noise floor is often used as a simple parameter to quantify instrument performance, since it indicates the lower limit of the precision that can be reached in the z axis in that instrument, and is also simple to measure.
It can be essential to know the noise floor of the AFM instrument to assure that high resolution measurements are meaningful. This can be particularly important for measurements of very small features (i.e. < 5nm), and for high resolution force spectroscopy. Measuring the noise floor can also help in optimizing instrument setup and vibration isolation. It is important to know the noise floor when using only the z piezo in the z feedback loop, as well as the noise floor of the z calibration sensor if there is one in the instrument. In most instruments, the noise floor of the z calibration sensor will be much higher than that of the z piezo.
In order to get reproducible results, all scan parameters should be maintained the same when comparing two results. Some factors, such as the PID values vary greatly from instrument to instrument, so the specific values to use cannot be suggested here. In each case, standard values should be established such that a fair comparison can be made.
Note that the procedure below is adapted from general guidelines given in Appendix B, page 195 of Eaton and West “Atomic Force Microscopy”. For a outline of a procedure that’s generally applicable to any model of AFM, take a look at the procedure below. Click here to find a specific procedure for measuring the z noise floor on a TT-AFM from AFM workshop.
Measuring noise floor in the z piezo signal
a) Place a flat, clean sample in the instrument. Use a new probe.
b) Do a probe approach and scan a small image on the sample to verify cleanliness and optimize the PID parameters.
c) Set the instrument to make a zero size scan such that the probe does not move in the x and y axis. Some instruments do not seem to have the option to do this (I have found that the JPK Nanowizard software does not allow this). In this case, make the smallest size scan you are able to , such as 1nm, or even less if possible).
d) Measure an image without probe motion in x or y, i.e. an image with a scan size of 0 nm, at a 1 Hz scan rate. A 128 x 128 pixel image is adequate. The data from the z piezo voltage should be used. This may be labelled height, or topography. The z scale should be in nanometers.
e) It may be necessary to flatten the data before the measurement, e.g. by a 1st order horizontal line levelling routine.
f) Calculate the RMS roughness (Rq, see chapter 5) of the image, this value is the noise floor.
If you get some transient noise in the image, from e.g. a person talking, or slamming a door, you can repeat the image.
The achievable noise floor varies from one instrument to another, as well as depending on the noise in the environment, the measurement parameters, and the vibration isolation, but typically a sub-Ångström noise floor can be achieved. An example of type of image you should get is shown in the image above. it's important that you scan a small image before doing the "zero size" image, as the instrument must be in feedback for the noise floor to be measured.
All text and images copyright Peter Eaton 2014-2018

