
This is the second part of this article about how to write an academic paper including AFM data. If you have not already, you should read the first part here.
NOTE: Some of this content is not really specific to AFM articles, but could be applied to any experimental scientific report. These parts should already be known to you if you are writing an scientific article, but many researchers are never taught how to correctly prepare a scientific article before they start writing them. For more general guides on preparing scientific articles, check here.
Figure legend. The figure legend is an important part of the figure. It should not be too brief, e.g. “Figure 1. AFM images of samples 1 and 2.”. But it should also not be too long. It should be concise, but has to have all the information needed to enable the reader to understand the figure. It should have a description of the type of data, if necessary explain the scale of the images, and clearly identify the samples shown. For example, a good figure legend might be: “Figure 1. Representative tapping mode AFM images of samples 1 and 2. A: Height image of sample 1; B: Phase image of sample 1; C: Height image of sample 2; D: Phase image of sample 2. All images show 1????m x 1????m areas, and the z scales are indicated next to the height images. The arrows show the location of anomalous nanoparticles discussed in the text.”
-
Reproducibility
All numeric values included in the results must be accompanied by standard errors, or standard deviation of the means. You must also say how many measurements were made. It is important to discuss how many areas were imaged, and how often the features discussed in the text occurred. It’s not acceptable to show only one image, with the assumption that it represents a whole sample!
-
Conclusions
It should go without saying that the conlcusions you make based on your AFM data must be justified. This often means that you should calculate the occurrence of specific features, so if you want to say that the surface got rougher, or features grew after treatment, you should measure this, and show means, and errors, or a histogram of results. Note that histograms can help a lot with non standard data distributions, i.e. where there are outliers.
Can lateral measurements be used in AFM? Yes - but with caution, and only sometimes. If you have samples that are small, comparable to an AFM probe tip, lateral measurements of them will be wildly erroneous with AFM. For this reason it’s nearly always preferable to use vertical measurements where possible. Lateral measurements typically only work well for features much larger than the AFM probe, so you must be careful with these. One way to reduce the effect of these errors is to deconvolve the probe shape from your images. See section 2.3.4 of Atomic Force Microscopy.
If your conclusions are based on certain small features in your images, you can present your images in a way so as to make these features clear. This can be done by:
-
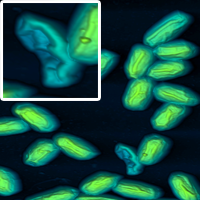
Cropping. A nice way to highlight certain features is to show a large image as well as a cropped section magnifying the feature you wish to show.
-
Histogram control. Control the height range shown in your height images to highlight the part you are interested in showing. So for example, if you wish to show tiny 20 nm features, you cannot do it with a z-scale of microns in a height image.
-
Shading. Light shading is a routine available in all AFM processing packages (such as SPIP and Gwyddion), which can highlight small topographic differences
-
Including error signals or phase images. These channels are frequently better for showing small details.
-
Highlighting with arrows. As discussed above.
-
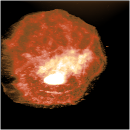
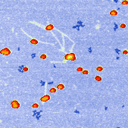
Using unusual colour schemes. In general complex colour schemes make for confusing images, but for some images they can be appropriate, and help to illustrate the different features at different heights.
Some examples of these schemes are shown below.
Good luck with your AFM articles! If you have more questions, contact me here.
NB. All the images in these two articles were produced with SPIP 6.7.7 or Gwyddion 2.40
This article and all content is copyright Peter Eaton and AFMHelp.com 2019.
- Details
- Hits: 7041
In my job as a researcher using AFM, I often act as a scientific reviewer for papers describing AFM experiments. I also collaborate with many groups and spend a lot of time revising and correcting articles which contain AFM data. In this two part article, I’ll describe how you should go about preparing a scientific paper which contains AFM data.
NOTE: Some of this content is not really specific to AFM articles, but could be applied to any experimental scientific report. These parts should already be known to you if you are writing an scientific article, but many researchers are never taught how to correctly prepare a scientific article before they start writing them. For more general guides on preparing scientific articles, check here.
What are the overall requirements for an AFM paper?
-
Experimental conditions should be well described
-
Data should be presented in a useful format
-
Reproducibility should be addressed
-
Conclusions should be justified
These requirements may seem like “common sense”, but you might be surprised by the number of articles which are published but do not meet some, or even all of these criteria!
-
Experimental conditions:
What should this include:
Imaging mode used. This is rather important, since the results can be different from mode to mode. It also helps to make your data reproducible. Note that not all instruments use the same terms to refer to specific modes :This is particularly the case for tapping mode. It can be useful to use both the manufacturer’s name, and the most commonly used name for example: Imaging was carried out in AC-AFM (Tapping) mode.”
Instrument used. You should name the instrument mode and the manufacturer. You can also include the version of the instrument model, if applicable. Some journals still request the location of the company, but this is becoming optional e.g., you might write “Bruker Multimode 8 (Bruker, Newhaven, CA)”.
Probe used. The type of probe used can determine the type of information available, as well as the interaction force. Since there are many probes available on the market, it’s also useful to say the (approximate) frequency of the probe, which gives some idea of the type of probe, without he use looking up the details. E.g. you might say “AppNano ACT probes with around 300 kHz frequency were used”.
Software used. All AFM images require image processing, or analysis before presentation. It is a good idea to describe the software used for processing of the AFM data. You might also describe the processes used for analysis and /or data processing. E.g. you might say “Gwyddion 2.49 software was used for processing the images, and Roughness was calculated with the Gwyddion 'Statistical Parameters' tool".
Amount of data collected, and statistical significance. This issue is addressed below. However, it's worth remembering, that the microscopy images you collect should be representative of the sample(s). A part of the “materials and methods” section should be explaining this. For example, you might write “At least six areas per sample were imaged, and representative images are shown here.” If you have a variety of different images, you could add additional images to a “supporting information” section.
-
Presenting data in a useful format
There are many different types of AFM images, and different ways to display them. Very often the instrument will produce several different image channels, such as height, phase, etc. The most commonly used channel is probably height, since this is the only one with three-dimensional data. However, sometimes, it’s hard to make out the sample details in height images. For this reason, other channels, such as deflection or phase are often used. I recommend that the height image, always come accompanied with a z scale (normally it’s a colour gradient), and they should have either an inset scale bar, distance markers on the outside, or the legend must state the scan size (x and y). Examples are shown below.
Does the colour I pick make any difference? No. You can choose which colours you like. For some reason, AFM images are “traditionally” shown in some shade of brown, but any colour scale is fine.
Should Amplitude/Deflection/Phase images have a z scale? No. The z scale on these channels is usually meaningless, as it might be in volts, or degrees, and in most conditions, is not needed. I recommend to remove it to avoid confusion.
Are the details you want to highlight easily visible? If not, the use of arrows to denote specific features in the image is recommended. The arrows should be referenced in the figure legend.
Talking of which, in part 2 of this article, I’ll talk about how a figure legend should be written, and how you should address reproducibility of the data, and draw appropriate conclusions from your results.
All images copyright peter Eaton 2019. Images produced with SPIP and Gwyddion software
- Details
- Hits: 7588
The Porto AFM Workshop 2019 has been announced. This is the sixth edition of the course!
The course will run from the 15th to 18th April. This is a training workshop, aimed at any researcher or scientist, who wants to learn about AFM, or increase their knowledge of the technique. Following the successful courses that have run since 2011, the course will includes several hours hands-on training in acquiring images with the atomic force microscope as well as AFM data processing.
NEWS:
- The course is now full, and no more registrations can be taken. Contact me at This email address is being protected from spambots. You need JavaScript enabled to view it. if you want to me notified about the next course.
- The timetable of the course is here. Note the room change, all lectures are to be given in room 0.36, in the library of the maths department.
Please click the image below to download the flyer with more details.

UPDATES:
- More details of the course will be announced soon, meanwhile, as usual, pre-registration can be made by emailing me at This email address is being protected from spambots. You need JavaScript enabled to view it.. Places on the course are very limited, so interested students should make enquiries or register as soon as possible.
- There will be some guest scientists, talking about advanced applications in different areas. More details will be announced soon
A blog with information and student feedback from the previous courses can be seen here:2017 course, 2014 course, 2013 course, 2011 course.
The course is supported by AFMWorkshop, The Faculty of Sciences of The University of Porto and my research institution, LAQV/Requimte.
- Details
- Hits: 6371
During our recent Porto AFM Training Workshop, we held a little competition, asking the students to produce and process the best images they could.
This year, the winner of the competition was Magdalena Scheibe, who produced this beautiful image of human hair. Well done, Magdalena!

However, we must also acknowledge two very inventive submissions, firstly this Game of Thrones-inspired one from Izabela (scanned with Anita), which actually shows a "wall" of nanoparticles, and nicely processed in SPIP.

And finally, this "Moonlanding" on another hair surface from Sandra and Rita. Very nice!
 Exploring Hair at the Nanoscale with AFM
Thanks to everyone who entered the competition!
All images Copyright AFMHelp.com and their respective creators.
- Details
- Hits: 4285
In this article, I’m going to talk about what not to do in AFM. I’ll list 4 mistakes that are common in AFM use, which if you avoid, will certainly improve your results!
-
Using standard settings.This is possibly the worst mistake you can make. AFM imaging is a highly adaptable technique. It’s able to image very large samples of tens of microns with extremely rough topography, or make tiny images of extremely smooth samples with subnanometer features. There is no standard setting which will get good images of all samples. You need to be able to adapt the imaging settings based on the response from the instrument. Optimal AFM imaging is attained through an iterative process! If you don’t know how to optimise imaging of the AFM, I highly recommend revising chapter 4 of my book, “Atomic Force Microscopy”.
-
Interpreting image artifacts as image features. It’s important to know which features in your image come from your sample, and which are image artifacts. Learning this can save you some major embarrassment, and a lot of time!
 Example of image showing imaging artifacts. being able to spot and correct these artifacts is a crucial skill for an AFM operator. Example of image showing imaging artifacts. being able to spot and correct these artifacts is a crucial skill for an AFM operator. |
- Trying to image dirty or contaminated samples. Sample preparation is the first, and most important part of an AFM experiment. If your sample has a layer of contaminant covering the the part you are interested in imaging, it will make your job almost impossible. Prepare your sample so that it only contains things you want to image.
- “Optimising” your imaging for a nice-looking amplitude (or deflection) image. I was amazed to find people do this. Amplitude and deflection images are made up of the error signal in AFM. The less contrast here is in the error signal, the more accurate your height image is. So, if you optimise imaging to produce a nice-looking high-contrast image in amplitude, you are decreasing the accuracy of your height image!
Avoid these pitfalls and your AFM work should be hassle-free! For help avoiding them I recommend reading my book, “Atomic Force Microscopy”, soon to be released in paperback!
All text and images copyright 2018 Peter Eaton, AFMHelp.com
- Details
- Hits: 7389
Subcategories
Page 4 of 21